digitaldna.SequencePlots
-
class
digitaldna.SequencePlots(alphabet=None)[source]¶ The Digital DNA plots utility class.
Parameters: - alphabet : string, optional
The sequences’ alphabet, used to show prettier labels, possible values are:
- ‘b3_type’
- ‘b3_content’
- ‘b6_content’
- None
Default: None
Methods
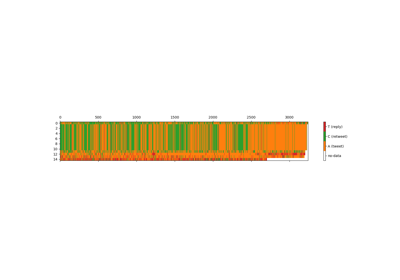
plot_alphabet_distribution(X)This function produces a box plot where each box represents the distribution of a letter in the sequences. plot_intersequence_entropy(X)This function produces a composite plot. plot_intrasequence_entropy(X)This function produces a box plot with a single box representing the distribution of the intra-sequence entropies (the Shannon Entropy computed over a single digital dna sequence). plot_sequences_color(X)This function produces a matrix image where each row is a digital dna sequence and each letter is represented by a different color. -
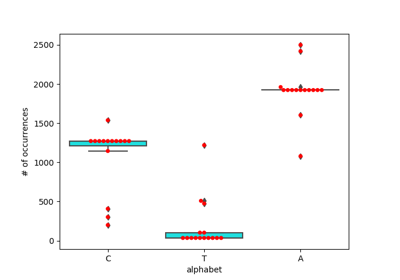
plot_alphabet_distribution(X)[source]¶ This function produces a box plot where each box represents the distribution of a letter in the sequences. The alphabet is inferred from the sequences.
Parameters: - X : array-like, shape (n_samples, 1), mandatory
The input sequences of digital dna
Returns: - y : an instance of self
-
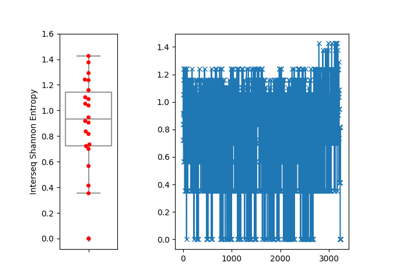
plot_intersequence_entropy(X)[source]¶ This function produces a composite plot. On the left a boxplot representing the distribution of the inter-sequence entropy (Shannon’s Entropy of the letters in the same with same sequence index but in different sequences). On the right a scatterplot of the entropies ordered by sequence index.
Parameters: - X : array-like, shape (n_samples, 1), mandatory
The input sequences of digital dna
Returns: - y : an instance of self
-
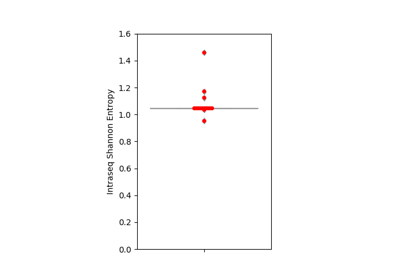
plot_intrasequence_entropy(X)[source]¶ This function produces a box plot with a single box representing the distribution of the intra-sequence entropies (the Shannon Entropy computed over a single digital dna sequence).
Parameters: - X : array-like, shape (n_samples, 1), mandatory
The input sequences of digital dna
Returns: - y : an instance of self


